Underground Storage Tank Case Study
September 18, 2023
In 2003, a third-party contractor conducted a phase II Environmental Site Assessment (“ESA”) due to light non-aqueous phase liquid (LNAPL) observed in one of the Underground Storage Tanks (“USTs”) nest piezometers. Soil and groundwater impacts exceeded the applicable criteria on and off-site (Figure 1). Follow-up groundwater monitoring events recorded concentrations of petroleum hydrocarbons (PHCs) in 2004 and 2005 exceeding guidelines.

The Problem
In 2003, a third-party contractor conducted a phase II Environmental Site Assessment (“ESA”) due to light non-aqueous phase liquid (LNAPL) observed in one of the Underground Storage Tanks (“USTs”) nest piezometers. Soil and groundwater impacts exceeded the applicable criteria on and off-site (Figure 1). Follow-up groundwater monitoring events recorded concentrations of petroleum hydrocarbons (PHCs) in 2004 and 2005 exceeding guidelines. The substances of potential concern (SOPCs) in soil include:
- Benzene
- Xylenes
- PHC fraction F1 and F2
In the groundwater only dissolved benzene concentrations exceeded guidelines. Soil impacts were delineated vertically and horizontally in 2015 by the same third-party contractor. In 2015, while no LNAPL was observed, a sheen was present in two monitoring wells. The UST nest piezometers had detectable LNAPL with 255 mm measured in one well. Soil data collected in 2016 indicated that concentrations of BTEX, F1, and F2 exceeded applicable criteria from the subsurface to 6 m bgl. The highest levels of contaminants were found from 1 to 4 m bgl.
The Implemented Solution
In 2016, two vertical infiltrators, each with a float level well and a nutrient injection well, were installed at the site to deliver the BioLodestone, a proprietary amendment solution. The BioLodestone solution was injected into the site for 3-4 months in 2016, 2017, 2018, 2019, 2020.
The Results
We focused our results on benzene, because it is the most recalcitrant of PHCs, and found to exceed criteria guidelines the most out of all PHCs present.
Soil benzene
Between 2016 and 2019, mean saturated soil benzene concentrations decreased by 97% (103 to 3 ppm; P < 0.05) (Figure 2). Both mean vadose soil benzene (6 to 9 ppm) and dissolved benzene groundwater (3 to 6 ppm) concentrations remained unchanged (P > 0.05). While the mean benzene concentrations give an overall site-level assessment of contamination and highlight the reduction of high concentrations, soil volume and mass estimates (below) better portray the spatial extent of contamination and areas above guidelines pre- and post-remediation treatment.
Soil volume and mass estimates
After 4 years of our remediation system running, we reduced the estimated volume and mass of benzene (SEQG Tier 2 guidelines, benzene concentrations > 8 ppm) in soil by 88% (Figure 1). Specifically, we reduced benzene volume in soil from 262 m³ to 31 m³ and estimated mass of benzene from 196 kg to 23 kg (Table 1).
Groundwater benzene
The extent of dissolved benzene in groundwater has been delineated with clean wells surrounding the plume, however there were four wells that had dissolved benzene concentrations exceeding applicable criteria in 2020 (Figure 1).
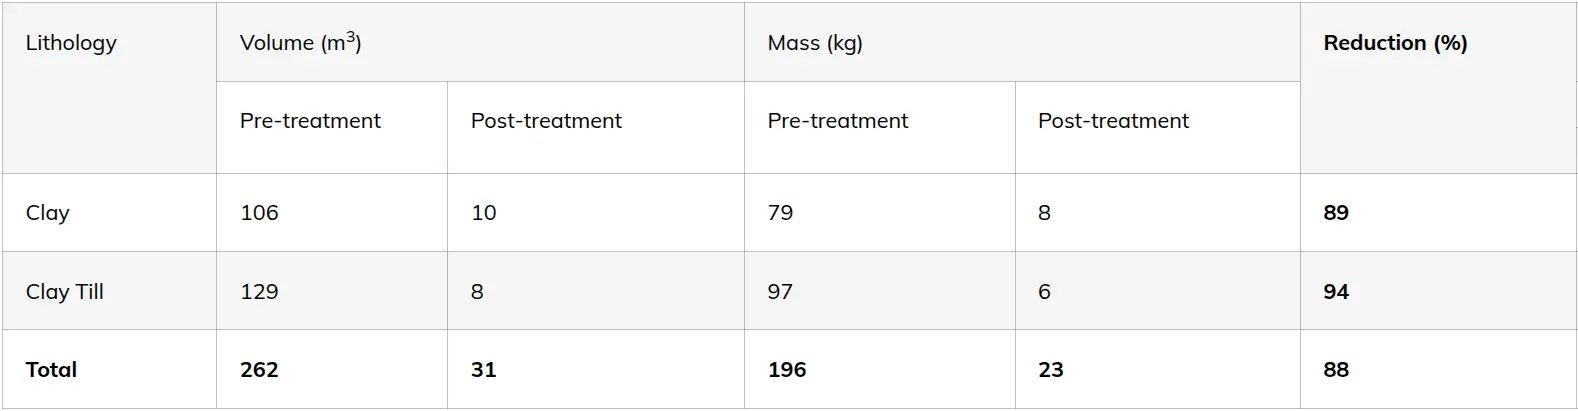
Table 1. Pre- and post-treatment volume (m³) and mass (kg) of soil benzene within the dominant soil lithologies on site. The reduction (%) of volume and mass of soil benzene is also shown.

Figure 1. Above: Aerial view of the site, indicating the site boundary, pumps, and underground storage tanks (USTs), locations of the infiltrators used as the remediation system, and groundwater wells that had dissolved benzene concentrations below Tier 2 guidelines (green dots) and locations of wells that exceeded applicable criteria (red; Tier 2 guideline: 4 mg/L) in 2020. Soil benzene concentrations at the site prior to remediation treatment (2016; middle) and post-treatment (2019; right). The aerial view of the benzene plume is at 3 m bgl, to show the depth with the highest concentration and extent. The cross-sections (inset) are through the borehole with the highest concentration. Black points indicate boreholes sampled.

Figure 2. Mean soil benzene concentrations in the saturated and vadose zones (left), and dissolved benzene concentrations in groundwater (right) with 95% confidence intervals at the site during 2016 and 2019 (for soil) 2020 (for groundwater). Canadian Council of Ministers of the Environment (CCME) and applicable Saskatchewan Environmental Quality Guidelines (SEQG) Tier 2 benchmarks of environmental quality are presented.
Team Leads

Steven Siciliano
As CEO of LiORA, Dr. Steven Siciliano brings his experience as one of the world’s foremost soil scientists to the task of helping clients to efficiently achieve their remediation goals. Dr. Siciliano has made significant contributions to the progress of environmental and soil science with 11 book chapters and 220 scientific papers which have been cited over 17,000 times.
Discover More
The latest industry news, interviews, technologies, and resources.
California Regulatory Approval for Risk Based Management
14 May 2026
This significant milestone marks the first sensor-based monitoring approval known in California, enabling effective NSZD quantification using only three strategically deployed sensors for enhanced environmental protection.

Cost Savings of NSZD Monitoring
13 May 2026
Achieved significant savings through innovative data collection and depletion rate monitoring with advanced sensor technology and real-time analytics. The project resulted in $748,680 in savings through the deployment of 17 sensors, collecting 23 million data points to monitor a 4,490 L/year depletion rate.