Over 2 million contaminated sites exist globally, and we continue polluting more sites than we clean up. This disparity between the problems we face and our ability to solve them through innovation creates what I call an ingenuity gap. The gap persists not because solutions do not exist, but because industry practices lag behind scientific advances by decades.
The National Research Council estimated in 2013[^1] that approximately 126,000 contaminated groundwater sites in the United States alone are unlikely to achieve cleanup goals in the foreseeable future. The publication can be found at https://doi.org/10.17226/14668. These complex sites require monitoring for decades, with costs accumulating year after year without corresponding progress toward closure.
Traditional monitoring approaches drain remediation budgets while failing to provide the information needed for efficient site management. Every dollar spent on redundant monitoring is a dollar not spent on actual remediation. Understanding this trade-off reveals the opportunity that statistical optimization presents.
Traditional groundwater monitoring represents one of the most persistent drains on remediation budgets across the environmental industry. The standard approach of quarterly sampling across extensive well networks remains largely unchanged for decades, even as statistical science advances dramatically.
The quarterly approach derives from a seminal 2016[^2] article by McHugh and colleagues in the journal Groundwater, demonstrating that plume stability and other plume dynamic estimates link directly to sampling frequency (https://doi.org/10.1111/gwat.12407). However, their research also showed that the relationship between monitoring frequency and monitoring duration is not site-specific. Organizations can apply general principles to optimize their programs without expensive site-by-site studies.
Two aspects drive groundwater monitoring costs: frequency and number of wells. Over the last 20 years, the field advanced beyond simple kriging, allowing practitioners to reduce the number of wells sampled while maintaining quality. The tools exist; the industry has not adopted them at scale.
Most groundwater monitoring networks were designed during initial site characterization, when contamination extent and behavior were poorly understood. Engineers installed wells conservatively to ensure adequate spatial coverage. This conservative approach made sense during characterization but becomes wasteful as sites mature.
As sites mature and contamination patterns become better defined, many wells continue to be sampled simply because they exist, not because they provide unique or actionable information. Regulatory permits often specify well networks by name, creating administrative barriers to optimization.
When evaluating site remediation costs, many organizations focus solely on laboratory analysis fees. This narrow view obscures true monitoring program costs and leads to poor optimization decisions.
True monitoring costs encompass multiple components:
Consider a typical petroleum contaminated site with 24 monitoring wells sampled quarterly. At an all-in cost of $1,500 per sample, annual monitoring costs approach $144,000. This expenditure repeats year after year, accumulating to over $1 million across a seven-year monitoring period.
If influence analysis identifies that 8 of these wells provide largely redundant information, reducing the network to 16 wells saves approximately $48,000 annually without compromising data quality. Over a seven-year monitoring period, cumulative savings approach $336,000 at this single site.
For organizations managing portfolios of 20 or more sites, these savings compound rapidly. A portfolio with average savings of $40,000 per site generates $800,000 in annual cost reduction.
Cost reduction means nothing if it compromises data quality. The more important question is whether network optimization maintains the statistical power needed for regulatory compliance and site management decisions.
The peer-reviewed research is clear on this point: properly implemented well influence analysis maintains or improves statistical power while reducing redundancy. Redundant wells, by definition, provide information that is already available from neighboring wells in the network. Removing redundant wells does not reduce the information content of the monitoring program because that information is captured by retained wells.
In some cases, network optimization improves data quality by focusing sampling effort on the wells that matter most. Resources saved from redundant sampling can support more frequent sampling at critical locations or more comprehensive analysis of collected samples.
The scientific literature offers numerous methods for optimizing groundwater monitoring networks. Three tools have emerged as practical, validated solutions for contaminated site management:
Each serves different organizational contexts and regulatory requirements. All three are free to use, eliminating cost barriers to adoption.
All three approaches share the goal of identifying which wells contribute unique information to site characterization and which provide redundant data that could be obtained from other locations. The mathematical approaches differ, but the fundamental question remains consistent: which wells can be removed without significantly affecting our understanding of site conditions?
Each method provides quantitative ranking of wells by their contribution to the monitoring program, replacing subjective judgment with data-driven analysis.
Best For: Organizations using GWSDAT for plume analysis
The Groundwater Spatiotemporal Data Analysis Tool (GWSDAT) is downloaded over 10,000 times globally (https://gwsdat.net) and is recommended by the Interstate Technology and Regulatory Council (ITRC). Shell Global Solutions originally developed the tool, and the University of Glasgow continues its enhancement with funding from the American Petroleum Institute.
Research published by Jones in 2022[^3] followed by a conference presentation by Radvanyi[^8] and colleagues at the University of Glasgow in 2023 demonstrated that the Well Influence Analysis method implemented in GWSDAT achieves 73% to 77% accuracy in approximating the gold standard cross-validation approach while requiring only a fraction of the computational resources. You can find this online at: https://doi.org/10.1111/gwmr.12522.
The method ranks monitoring wells by their influence on contaminant concentration estimates, identifying candidates for potential omission from future sampling campaigns. Wells with low influence contribute information that neighboring wells already provide, making them candidates for removal without affecting characterization accuracy.
Strengths:
Limitations:
Technical Details
Best For: Organizations with Python capabilities and comprehensive historical monitoring data
For organizations with Python capabilities and extensive historical monitoring data, PySensors offers the most computationally efficient approach through QR decomposition with column pivoting. This data-driven method ranks monitoring wells by their contribution to reconstructing the complete groundwater state across the monitoring domain.
The validation results from published research are remarkable. Applied to 480 wells in the Upper Rhine Graben with data spanning 1990 to 2015, the method demonstrated that a 94% network reduction achieved 0.1-meter average reconstruction accuracy for groundwater levels[^9]. Even maintaining stricter 0.05-meter accuracy allowed 69% network reduction. You can find this work at https://doi.org/10.5194/hess-26-4033-2022
The scale of validated network reduction challenges assumptions embedded in current monitoring practice. If 94% of wells can be removed while maintaining accurate characterization, current networks are dramatically oversized relative to information requirements.
Best For: EPA regulated Superfund sites
The Monitoring and Remediation Optimization System (MAROS) is a free Microsoft Access application developed specifically for EPA-regulated sites by GSI (https://www.gsienv.com). The tool provides standardized statistical evaluation using approaches that state and federal regulators recognize and accept.
MAROS evaluates each well by its contribution to understanding plume behavior and identifies wells that can be removed without significantly impacting the statistical characterization of site conditions. The leave-one-out cross-validation approach systematically tests what happens when each well is excluded, providing direct evidence of redundancy.
The tool produces documentation suitable for regulatory submittals, with formatted outputs that match expectations for monitoring optimization proposals.
MAROS serves best at EPA-regulated Superfund sites where standardized statistical evaluation matches regulatory expectations. The tool provides entry-level analysis suitable for sites without specialized statistical expertise.
The methodology limitations should be understood: MAROS provides backward-looking statistical analysis without predictive capability. Like GWSDAT, the tool describes historical patterns without forecasting future behavior under changed conditions.
The following table illustrates potential annual savings based on typical network optimization outcomes, assuming quarterly sampling at $1,500 per sample:

Statistical ranking alone does not provide sufficient justification for removing wells from a monitoring program. Professional judgment must integrate statistical analysis with site-specific knowledge that models cannot capture:
Organizations should engage regulators early in the optimization process, before committing to specific well removals. Early engagement identifies potential objections and allows program modifications before significant analytical investment. Many regulators welcome optimization proposals that demonstrate scientific rigor and cost-consciousness. The key is presenting optimization as improved monitoring rather than reduced monitoring, emphasizing that optimized networks maintain or improve data quality while eliminating redundancy.
Quarterly sampling provides only four data points per year per well, creating gaps in understanding of dynamic groundwater systems. Between sampling events, conditions can change dramatically without detection. Plumes can expand 30% to 50% before quarterly sampling identifies the change, delaying response and increasing remediation costs.
The McHugh et al. (2016) research demonstrated quantitative relationships between monitoring frequency and the time required to characterize attenuation rates with defined accuracy. Doubling sampling frequency can reduce the time needed to establish trends by nearly 50%, but at the cost of more than tripling sampling events.
Traditional quarterly monitoring programs at a typical 24-well site cost $60,000 or more annually when all components are accounted: field mobilization, laboratory analysis, data management, and professional reporting time. These programs provide four snapshots per year with no predictive capability.
The $60,000 figure often surprises site managers who focus on laboratory invoices without tracking the full cost of their monitoring programs. When field technician time, travel expenses, data management, and reporting hours are properly attributed, traditional monitoring costs far exceed laboratory fees alone.
This expenditure recurs year after year, accumulating to over $300,000 across a five-year monitoring period at a single site. Portfolio-wide costs reach millions of dollars annually, representing resources that could fund remediation activities if monitoring efficiency improved.
The math is straightforward. Traditional quarterly monitoring programs typically cost $60,000 or more per site annually. LiORA Trends provides superior analytical capabilities, including predictive modeling that free tools cannot offer, for $5,000 to $7,000 per site. Even accounting for the software investment, organizations achieve 90% or greater reduction in analytical expenses while gaining forward-looking intelligence.
For a portfolio of five sites, the comparison becomes even more compelling:
The savings can fund actual remediation activities that accelerate site closure, or improve the bottom line while maintaining regulatory compliance.
The predictive capability adds value beyond direct cost comparison. Decisions made with forward-looking intelligence avoid costs that decisions made with backward-looking data cannot anticipate.
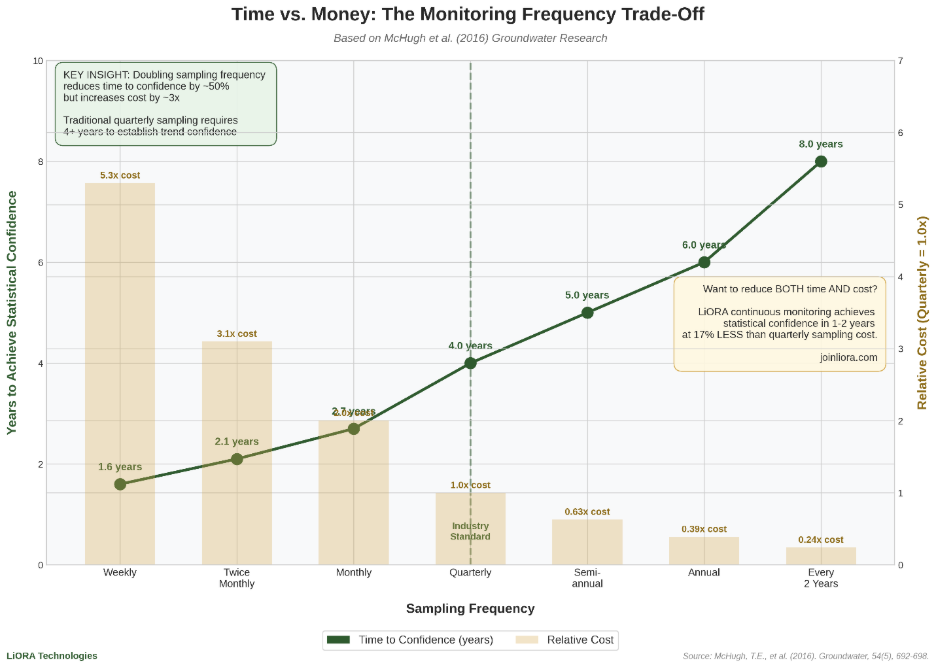
Based on McHugh et al. (2016) Groundwater Research
KEY INSIGHT: Doubling sampling frequency reduces time to confidence by ~50% but increases monitoring events by 3x. Traditional quarterly sampling requires 4+ years to establish trend confidence.
LiORA continuous monitoring achieves statistical confidence in 1-2 years at lower cost than quarterly sampling while providing 17,520 data points per year versus 4.
Want to reduce BOTH time AND cost?
While GWSDAT, PySensors, and MAROS provide valuable backward-looking analysis, contaminated site management increasingly demands forward-looking intelligence. Site managers need to know not just what happened, but what will happen under different management scenarios.
Free tools cannot provide this predictive capability because their statistical methods describe historical patterns without incorporating physical understanding of contaminant transport.
LiORA Trends addresses this gap by combining the proven Well Influence Analysis methodology from GWSDAT with ModFlow 6 numerical modeling capabilities. This integration delivers both historical analysis and predictive forecasting in a single platform.
Platform capabilities include:
LiORA Sensors provide autonomous, continuous measurement of groundwater contaminant concentrations, eliminating the data gaps that force reliance on conservative model defaults. The sensors deploy directly in monitoring wells where they operate without manual intervention, measuring every 30 minutes throughout the year regardless of weather, holidays, or staff availability.
This measurement frequency generates 17,520 data points per year from each sensor location, providing the temporal resolution needed to observe and understand dynamic subsurface processes. Compare this to the four data points per year from quarterly sampling. The 4,380-fold increase in data density transforms site characterization from estimation to observation.
LiORA Sensors measure petroleum hydrocarbon concentrations directly, providing the specific contaminant data needed for transport modeling and regulatory compliance rather than surrogate parameters that must be interpreted.
The sensors transmit data wirelessly to the LiORA Trends platform, where it is automatically quality-checked and incorporated into site models without manual data handling steps that introduce delays and errors.
LiORA Sensors cost $5,000 per sensor per year, a single figure that covers:
Traditional quarterly sampling costs approximately $6,000 per well per year when all costs are properly accounted, including mobilization, purging, sample collection, shipping, laboratory analysis, data validation, and reporting.
This means LiORA provides 4,380 times more data for 17% less cost, a value proposition that improves site characterization while reducing monitoring expenditure.
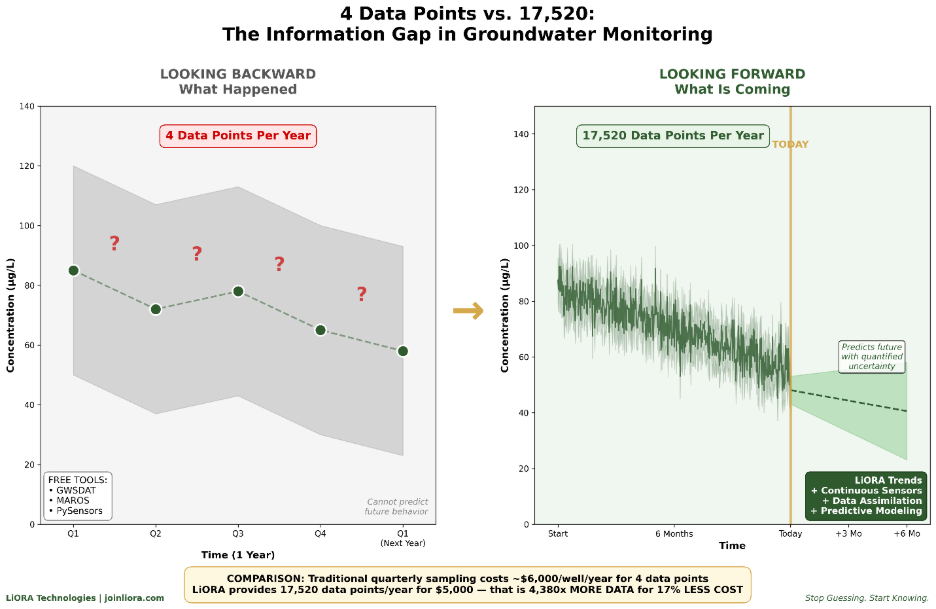
LOOKING BACKWARD (What Happened)
FREE TOOLS:
LOOKING FORWARD (What Is Coming)
LiORA Trends:
COMPARISON: Traditional quarterly sampling costs ~$6,000/well/year for 4 data points. LiORA provides 17,520 data points/year for $5,000 - that is 4,380x MORE DATA for 17% LESS COST
The era of monitoring every well simply because it exists is ending, replaced by a smarter, data-driven approach that delivers better outcomes at lower cost. The scientific literature provides validated, practical tools for identifying redundant wells and optimizing monitoring networks at contaminated sites.
GWSDAT, PySensors, and MAROS each offer distinct advantages depending on organizational context and regulatory requirements. All three are free, validated against peer-reviewed research, and capable of identifying significant cost savings without compromising data quality.
For organizations seeking predictive intelligence beyond backward-looking analysis, LiORA Trends combines the proven GWSDAT methodology with ModFlow 6 numerical modeling at a fraction of traditional monitoring costs. The platform delivers both the well influence analysis you need today and the plume forecasting capabilities required for proactive site management.
The question is no longer whether to optimize your monitoring network, but how quickly you can begin realizing the benefits of smarter, more efficient groundwater monitoring strategies. Every quarter of delay costs money spent on redundant sampling and opportunities missed for better site understanding.
Start with the tool that matches your capabilities:
Run initial analyses on pilot sites to build confidence and capability. Scale successful approaches across your portfolio as results demonstrate value.
For organizations ready to move beyond backward-looking analysis to predictive intelligence, contact LiORA Technologies to discuss how continuous monitoring and data assimilation can transform your approach to contaminated site management.
Continuous groundwater monitoring provides 17,520 data points per year per location compared to four data points from quarterly sampling, representing a 4,380-fold increase in temporal resolution. This data density enables:
Peer-reviewed research demonstrates that continuous monitoring achieves regulatory confidence in one to two years rather than the five or more years required with quarterly sampling.
LiORA technology differs from traditional methods in three fundamental ways:
Traditional monitoring provides historical snapshots; LiORA provides continuous intelligence with predictive capability.
Traditional quarterly sampling costs approximately $6,000 per well per year when all costs are properly accounted, including:
For a typical 24-well site, annual monitoring costs approach $144,000.
LiORA Sensors cost $5,000 per sensor per year, covering continuous measurement, wireless data transmission, automated quality assurance, and platform access.
LiORA Trends analytical platform costs $5,000 to $7,000 per site annually.
Organizations achieve 90% or greater reduction in analytical expenses while gaining predictive capabilities that traditional monitoring cannot provide.
Well influence analysis is a statistical method that identifies which monitoring wells contribute critical versus redundant information to plume characterization. The method, implemented in GWSDAT using influence statistics from P-splines regression, ranks wells by their effect on contaminant concentration estimates.
Research by Radvanyi and colleagues at the University of Glasgow demonstrated that this approach achieves 73% to 77% accuracy compared to computationally intensive cross-validation methods. Wells with low influence scores provide information already captured by neighboring wells and are candidates for removal without affecting characterization accuracy.
Yes, monitoring costs can be reduced 30% to 50% or more without compromising regulatory compliance when optimization is based on sound statistical analysis. The key is demonstrating that optimized networks maintain the statistical power needed for site characterization.
Peer-reviewed research confirms that properly implemented well influence analysis maintains or improves data quality while eliminating redundancy. Early regulatory engagement, comprehensive documentation, and pilot programs that demonstrate optimized network performance provide the defensible justification that regulators require before approving reduced monitoring programs.
Three primary free tools are available for monitoring network optimization:
Each tool serves different organizational contexts and regulatory requirements.
Peer-reviewed research demonstrates 70% uncertainty reduction within one year of subhourly monitoring. Plume area estimates typically converge to true values within two years as data assimilation progressively replaces conservative defaults with data-constrained parameters.
Compare this to the five or more years required to achieve equivalent statistical confidence with quarterly sampling. The rapid improvement enabled by continuous monitoring accelerates confident decision-making and shortens the path to site closure.
Continuous monitoring data is increasingly accepted by regulatory agencies as the technology matures and case studies demonstrate reliability for compliance applications. LiORA works with clients to ensure data formats, quality assurance protocols, and reporting structures meet the specific requirements of relevant regulatory programs.
Early engagement with regulators during program design helps ensure that continuous monitoring data will be accepted for intended compliance applications. The documented cost savings and improved data quality typically build regulatory support for innovative monitoring approaches.
Data assimilation is a mathematical framework for systematically updating model parameters as new observations become available, combining the physical understanding embedded in process-based models with site-specific information contained in monitoring data.
Methods like the Ensemble Kalman Filter compare model predictions to sensor measurements and adjust parameters to reduce the difference between predicted and observed values. This process runs continuously as new data arrives, progressively replacing conservative defaults with data-constrained values that accurately represent site conditions.
LiORA Sensors measure petroleum hydrocarbon concentrations directly, providing the specific contaminant data needed for transport modeling and regulatory compliance at:
The sensors provide real-time concentration measurements that feed data assimilation algorithms, enabling continuous parameter updating that improves model accuracy over time as observations accumulate.
Site closure requires demonstrating that contamination is stable or declining and that concentrations meet applicable standards. Quarterly sampling requires five or more years to establish statistically significant trends due to the limited information content of sparse data.
LiORA continuous monitoring achieves equivalent statistical confidence in one to two years by providing the data density needed for reliable trend analysis. Additionally, the predictive modeling capability enables optimized remediation strategies that target actual contamination rather than conservative estimates, reducing both remediation costs and timelines.
[^1]: Council, N. R. Alternatives for Managing the Nation's Complex Contaminated Groundwater Sites; The National Academies Press, 2013. DOI: doi:10.17226/14668.
[^2]: McHugh, T.; Kulkarni, P.; Newell, C. Time vs. Money: A Quantitative Evaluation of Monitoring Frequency vs. Monitoring Duration. GROUNDWATER 2016, 54 (5), 692-698. DOI: 10.1111/gwat.12407.
[^3]: Jones, W.; Rock, L.; Wesch, A.; Marzusch, E.; Low, M. Groundwater Spatiotemporal Data Analysis Tool: Case Studies, New Features and Future Developments. GROUND WATER MONITORING AND REMEDIATION 2022, 42 (3), 14-22. DOI: 10.1111/gwmr.12522.
[^8]: Radvanyi, P.; Claire, M.; Craig, A.; Low, M.; Jones, W. R. Computationally Efficient Ranking of Groundwater Monitoring Locations. In Proceedings of the 37th International Workshop on Statistical Modelling (IWSM): 332-338, 2023.
[^9]: Ohmer, M.; Liesch, T.; Wunsch, A. Spatiotemporal optimization of groundwater monitoring networks using data-driven sparse sensing methods. HYDROLOGY AND EARTH SYSTEM SCIENCES 2022, 26 (15), 4033-4053. DOI: 10.5194/hess-26-4033-2022.
Contact LiORA to learn how continuous monitoring and predictive intelligence can reduce your monitoring costs by 30-90% while improving site closure timelines.
Website: www.joinliora.com

As CEO of LiORA, Dr. Steven Siciliano brings his experience as one of the world’s foremost soil scientists to the task of helping clients to efficiently achieve their remediation goals. Dr. Siciliano is passionate about developing and applying enhanced instrumentation for continuous site monitoring and systems that turn that data into actionable decisions for clients.