I have spent years watching site managers struggle with a problem they cannot easily see: their plume maps are wrong. These maps are not slightly wrong, but systematically wrong in ways that cost real money and extend project timelines unnecessarily.
The contamination boundaries drawn on quarterly monitoring reports almost always extend further than the actual contamination, leading to remediation plans that treat areas that were never truly impacted. This systematic overestimation represents one of the most significant yet overlooked sources of waste in environmental remediation.
The consequences of plume overestimation cascade through every aspect of site management:
Understanding the root cause of this problem is the first step toward implementing groundwater plume monitoring solutions that deliver accurate results.
This systematic overestimation is not the result of carelessness or incompetence among environmental professionals. It is the predictable consequence of how we build predictive models with insufficient data, a limitation imposed by traditional quarterly sampling programs.
The peer-reviewed literature on groundwater transport modelling reveals that when we lack the field measurements needed to properly calibrate our models, we substitute conservative default parameters that systematically overestimate plume migration. The question facing site managers is therefore not whether their plume estimates are biased, but by how much, and what they can do about it.
Groundwater transport models require calibration, and this requirement is not optional for any practitioner seeking accurate predictions. The hydraulic conductivity fields, dispersivity values, and reaction rate constants that govern contaminant movement through aquifers cannot be measured directly at the scales relevant to plume prediction.
These parameters must instead be inferred from observations of system behaviour, comparing model outputs to field measurements and adjusting values until acceptable agreement is achieved. Without adequate calibration data, models cannot reliably distinguish between different possible representations of subsurface conditions.
The fundamental challenge, as Fiori and colleagues documented in Frontiers in Environmental Science (2019)(1), is that measurements of piezometric heads and pollutant concentrations at contaminated sites are sparse and may not be representative of heterogeneous hydrogeologic conditions.
Prediction of transport is affected by uncertainty that researchers can quantify but not eliminate. That uncertainty is prone to be even greater for the common, less detailed, site data available in practice where budgets constrain the extent of characterisation efforts.
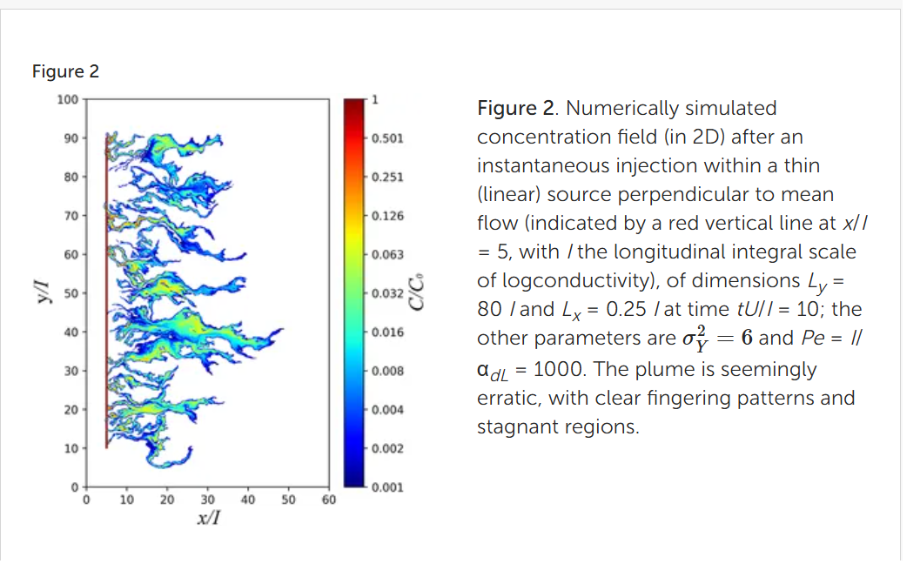
Figure 2 of this research, available at https://doi.org/10.3389/fenvs.2019.00079, establishes that data scarcity is not merely inconvenient but fundamentally limits prediction accuracy.
Hill and Tiedeman made this point forcefully in their foundational USGS text Effective Groundwater Model Calibration (2007), noting that using direct measurements of system characteristics to construct a model often produces simulated values that poorly match observations.
The measurements we can make characterise properties at different scales from our model grid cells, creating a fundamental disconnect between what we measure and what we need to know. These measurements also contain errors that propagate through simulations in ways that are difficult to track, compounding uncertainty at each step of the modelling process.
Höglund and colleagues, reviewing Swedish groundwater modelling practice in 2024(2), found systemic problems that extend beyond individual site limitations to reflect industry-wide patterns. Their review identified claims that conservative parameter values are used without stating the values or how they were assigned, making it impossible to assess the degree of conservatism applied.
Their findings, published in Hydrogeology Journal and available at DOI:https://doi.org/10.1007/s13280-024-02068-7, suggest that current practice systematically favours conservatism over accuracy.
When calibration data is sparse, practitioners substitute software defaults or literature values for site-specific parameters, a practice that introduces systematic bias into predictions. Chowdhury and Rahnuma documented this explicitly in Water Practice and Technology (2023)(3) at https://doi.org/10.2166/wpt.2023.076:
The value of specific storage and yield was taken as 10^-5 and 0.2, which is the default value of MODFLOW.
This reliance on defaults is understandable given time and budget constraints, but it transforms site-specific predictions into generic estimates that may bear little relationship to actual conditions. The prevalence of this practice means that many plume predictions share the same systematic biases regardless of actual site characteristics.
Locatelli and colleagues, writing in the Journal of Contaminant Hydrology (2019)(4), described models explicitly designed for regulatory use that provide conservative estimations useful when a large number of contaminated sites are to be assessed with limited data.
However, these models are useful as a screening tool, and more site-specific models are needed for remediation management decision making where accuracy directly affects costs and timelines.
The research available at https://doi.org/10.1016/j.jconhyd.2018.11.002 confirms that conservative screening models should not be confused with accurate site characterisation tools.
Thornton and colleagues made a related point in 2001(5) that remains highly relevant to contemporary practice. The uncertainty in parameter inputs for solute transport models creates cumulative uncertainties in the anticipated plume behaviour that compound through each step of the simulation process.
These uncertainties may be large, variable, and as important in the risk assessment process as the contaminant concentration estimates themselves, yet they are rarely communicated to decision-makers. Understanding and quantifying these cumulative uncertainties is essential for making informed decisions about remediation investments.
The implications of systematic plume overestimation extend far beyond academic interest in model accuracy. Overestimated plumes translate directly into:
The site manager who believes their plume extends 200 metres downgradient when it actually extends 120 metres will design a remedy for the wrong problem and spend years wondering why progress seems slower than expected.
The solution to poorly constrained parameters is more data, applied intelligently through mathematical frameworks designed to extract maximum information from observations. Data assimilation provides such frameworks, offering mathematically rigorous approaches for updating model parameters as new measurements become available rather than relying on static calibration performed once at project inception.
These methods have been developed and refined over decades in weather forecasting and oceanography, where the value of continuous observation updates was recognised early. Their application to groundwater modelling represents a natural extension of proven technology to a domain where data scarcity has long limited prediction accuracy.
Doherty's seminal paper in Groundwater (2003)(6) introduced pilot point methods that revolutionised how practitioners think about spatial parameter estimation. These methods allow the disposition of areas of high and low hydraulic property value to be inferred through the calibration process, letting data rather than preconceptions drive the estimated parameter field.
Pilot points can be used either as a substitute for zones of piecewise parameter uniformity, or in conjunction with such zones. In either case, they allow the disposition of areas of high and low hydraulic property value to be inferred through the calibration process, without the need for the modeler to guess the geometry of such areas prior to estimating the parameters that pertain to them.
The research available at https://doi.org/10.1111/j.1745-6584.2003.tb02580.x established a foundation that subsequent data assimilation methods have built upon.
The subsequent USGS guide by Doherty and Hunt (2010)(7) established that regularised inversion interjects greater parameter flexibility into all stages of calibration than offered by precalibration parameter-simplification strategies.
The guide, available at https://pubs.usgs.gov/sir/2010/5169/, provides practical implementation guidance that has enabled widespread adoption of these methods.
Ensemble Kalman filter methods have proven particularly effective for groundwater applications where conditions change over time and models must adapt accordingly. Hendricks Franssen and Kinzelbach demonstrated real-time joint estimation of model states and hydraulic parameters in Water Resources Research (2008)(8), showing that continuous parameter updating could track changing conditions.
Their work, available at https://doi.org/10.1029/2007WR006505, established the feasibility of adaptive groundwater modelling that improves as observations accumulate.
Ross and colleagues showed in Groundwater (2018)(9) that the correlations underpinning EnKF updating implicitly contain information about how the plume developed over time under the influence of complex site hydrology and variable source history.
The correlations that underpin EnKF updating implicitly contain information about how the plume developed over time under the influence of complex site hydrology and variable source history, as they are predicated on multiple realizations of a well-calibrated numerical groundwater flow and transport model.
This information enables superior predictions compared to ordinary kriging, which treats each location independently without considering the physical processes that created the observed concentration pattern. The Ensemble Kalman Filter essentially learns from the pattern of observations to infer the underlying transport processes, not just the current concentration distribution.
The fundamental advantage of data assimilation is that models learn from data rather than remaining anchored to initial assumptions regardless of subsequent observations. As observations accumulate, parameter estimates converge toward values that represent site conditions, progressively replacing conservative defaults with data-constrained estimates.
The practical implication is that models become more accurate over time as data accumulates, which traditional static calibration approaches cannot achieve.
Autonomous sensors change the fundamental calculus of groundwater monitoring by providing the data density that data assimilation methods require to achieve their full potential. Data assimilation works better with more data, and the improvement is not merely incremental but follows a pattern where uncertainty reduction accelerates as observation frequency increases.
Traditional quarterly sampling provides too few observations to constrain the many parameters that influence plume behaviour, forcing reliance on defaults that introduce systematic bias. Continuous monitoring removes this constraint, enabling the data-driven parameter estimation that produces accurate predictions.
The strongest evidence for the sensor advantage comes from Han and colleagues, publishing in Water Resources Research (2023)(10), who developed Bayesian Calibration using Multisource Observations to simultaneously assimilate laboratory and in-situ sensor data.
Their finding deserves emphasis: with one year of subhourly sensor data incorporated, modelling uncertainty of concentration and management cost were reduced by 70%, a transformation rather than mere incremental improvement.
This research, available at https://doi.org/10.1029/2022WR033673, provides quantitative evidence that continuous monitoring enables uncertainty reduction impossible to achieve with quarterly sampling regardless of how many years of data are collected.
Van der Spek and Bakker investigated the relationship between calibration period length, observation frequency, and prediction uncertainty in Water Resources Research (2017)(11), systematically varying these factors to understand their relative importance.
They found that 95% credible intervals can be reduced to approximately 10% of their initial width with appropriate temporal data coverage, but this reduction requires observation frequencies far exceeding what quarterly sampling provides.
It is often assumed that the required length of the calibration period is related to the response time of the system. In this study, no strong relationship was observed. Results indicate, however, that the required length of the calibration period is related to the decay time of the noise. Furthermore, the length of the calibration period was much more important than the total number of observations.
Their research, available at https://doi.org/10.1002/2016WR019704, demonstrates that observation frequency and calibration period length both contribute to uncertainty reduction, but frequency has the larger effect.
Schmidt and colleagues demonstrated practical implementation of sensor-based data assimilation at the Savannah River Site, publishing their findings in Environmental Science & Technology (2018)(12). They used Kalman filter-based real-time monitoring with autonomous sensors measuring contaminant concentrations continuously.
Their framework enabled early warning for unexpected changes in plume migration while significantly reducing required sampling frequency, addressing both accuracy and cost concerns simultaneously. The research available at https://doi.org/10.1021/acs.est.8b00017 provides a template for implementing continuous monitoring at other sites.
A key innovation in this paper was the use of indirect measurements of contaminants of concern, in this case tritium and uranium, by measuring specific conductance and pH for their data assimilation.
Consider what continuous monitoring means in practical terms for the information available to constrain models and support decisions:
Data Density Comparison:
The 4,380-fold increase in data density represents the difference between knowing and guessing about subsurface conditions. Every measurement constrains the model by eliminating parameter combinations that would produce predictions inconsistent with observations, progressively narrowing the range of plausible model configurations.
LiORA Sensors provide autonomous, continuous measurement of groundwater contaminant concentrations, eliminating the data gaps that force reliance on conservative model defaults. The sensors are deployed directly in monitoring wells where they operate without manual intervention, measuring every 30 minutes throughout the year regardless of weather, holidays, or staff availability.
This measurement frequency generates 17,520 data points per year from each sensor location, providing the temporal resolution needed to observe and understand dynamic subsurface processes. The autonomous operation eliminates the mobilisation costs and scheduling constraints that limit traditional sampling programs.
LiORA Sensors measure petroleum hydrocarbon concentrations directly, providing the specific contaminant data needed for transport modelling and regulatory compliance rather than surrogate parameters that must be interpreted.
The sensors transmit data wirelessly to the LiORA Trends platform, where it is automatically quality-checked and incorporated into site models without manual data handling steps that introduce delays and errors.
LiORA Sensors cost $5,000 per sensor per year, covering:
Traditional quarterly sampling costs approximately $6,000 per well per year when all costs are properly accounted, including mobilisation, purging, sample collection, shipping, laboratory analysis, data validation, and reporting.
This means LiORA provides 4,380 times more data for 17% less cost, a value proposition that improves site characterisation while reducing monitoring expenditure.
LiORA Trends is the software platform that transforms continuous sensor data into actionable information for site management decisions. The platform incorporates:
1. GWSDAT Integration
2. Machine Learning-Based Plume Prediction
3. Data Assimilation
4. Well Influence Analysis
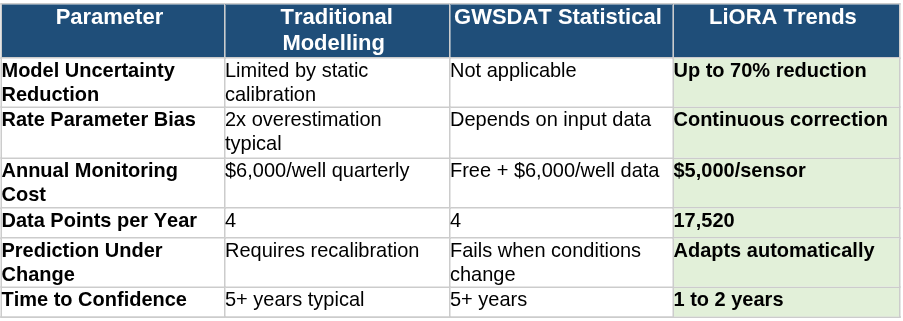
Table Takeaway: Data assimilation with continuous sensors costs less than quarterly sampling ($5,000 vs $6,000 annually) while reducing model uncertainty by up to 70% and achieving regulatory confidence in 1 to 2 years rather than 5+ years.
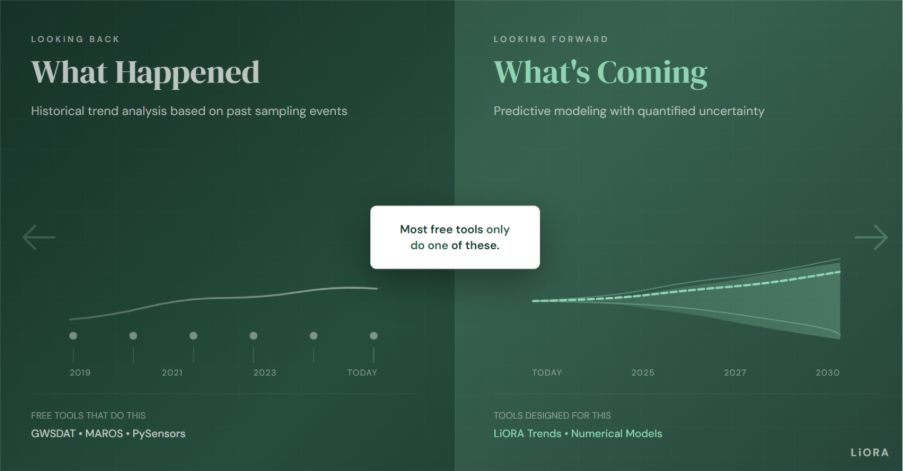
I should be clear about what data assimilation is not, because confusion between data assimilation and statistical trend analysis leads to inappropriate tool selection. Data assimilation is not the same as statistical trend analysis, although both use historical data and both produce outputs that might superficially appear similar.
Statistical methods identify patterns in historical observations without incorporating physical understanding of the processes that created those patterns. Data assimilation combines observations with process-based models to update parameters and improve predictions, a fundamentally different approach with different strengths and limitations.
Tools like GWSDAT apply Mann-Kendall tests and Penalized Spline estimators to concentration time series, identifying whether concentrations are increasing, stable, or decreasing with statistical significance.
This historical trend analysis is valuable for understanding what happened at a site and for demonstrating regulatory compliance based on documented concentration changes. However, statistical trend detection is not reliable for predicting what will happen when conditions change, because it extrapolates from patterns without understanding the processes that created them.
McConnell, Detloff, and Truex stated the fundamental limitation directly in Ground Water Monitoring & Remediation (2022)(13):
If new sources or significant changes in groundwater flow occur, these forecasting algorithms may not effectively forecast trend changes... The interpretation of these data is often based on nonparametric trend analysis, such as the Mann-Kendall method, which is not appropriate to predict future concentrations.
The research available at https://doi.org/10.1111/gwmr.12523 documents this limitation with examples from actual site applications.
Wang and colleagues quantified Mann-Kendall test limitations through systematic Monte Carlo simulations published in Frontiers in Earth Science (2020)(14). They found that:
The statistical power of the test declines with increasing sample variance, meaning that the noisier the data, the harder it becomes to detect real trends even when they exist.
Sample Size Requirements:
The research available at https://doi.org/10.3389/feart.2020.00014 provides quantitative relationships between data characteristics and test performance.
Chen and colleagues provided direct comparison between statistical and numerical modelling approaches in Scientific Reports (2020)(15), finding that while machine learning and statistical methods achieved better accuracy during calibration periods when historical patterns continue unchanged, the overall generalisation ability of numerical models is superior when conditions depart from historical patterns.
This distinction matters because groundwater sites are not static systems but evolve in response to natural processes, remediation activities, and changing land use. Statistical methods are:
mappings between inputs and outputs based on statistics without deduction of physical process, which limits their applicability to conditions similar to those in the training dataset.
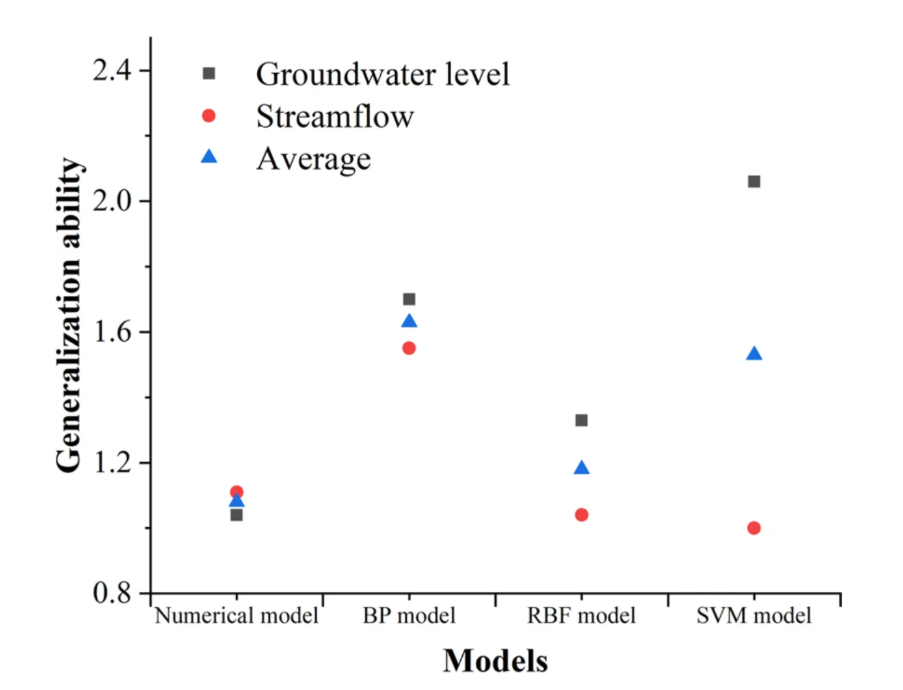
Figure 1 illustrates the contrasting pathways between traditional modelling and data assimilation approaches, showing how each arrives at plume boundary estimates through fundamentally different processes.
The Traditional Path:
The Data Assimilation Path:
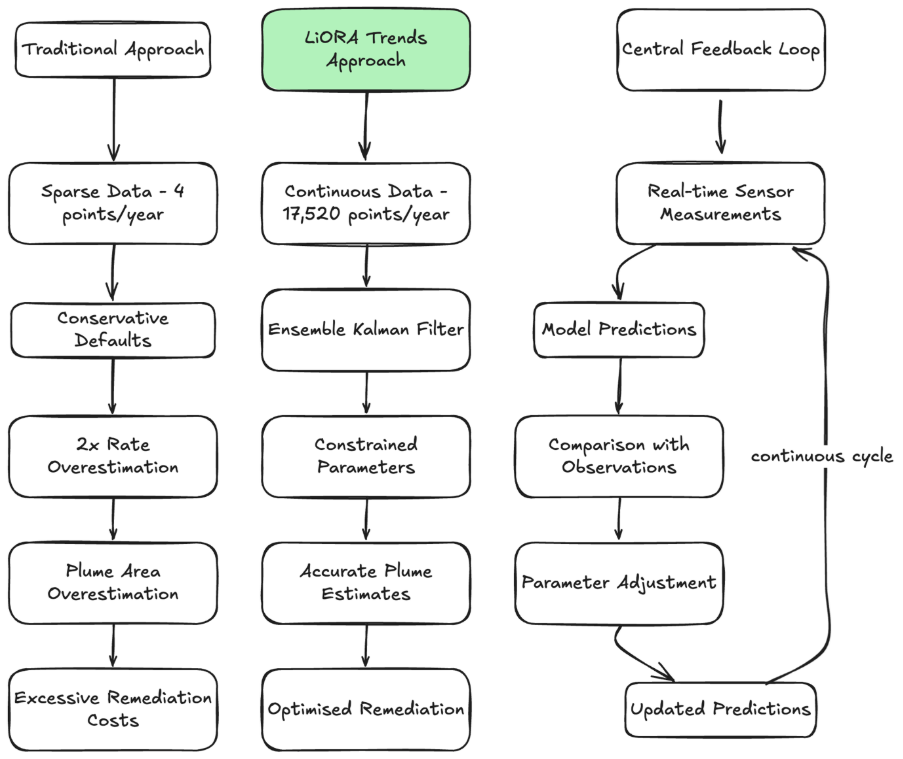
The difference between the two paths is not in the mathematical framework but in the information available to constrain that framework.
Figure 2 shows how model uncertainty and plume area estimates evolve over time under both quarterly sampling and continuous monitoring regimes, quantifying the practical implications of the theoretical differences between approaches.
With Quarterly Sampling:
With Continuous Monitoring:
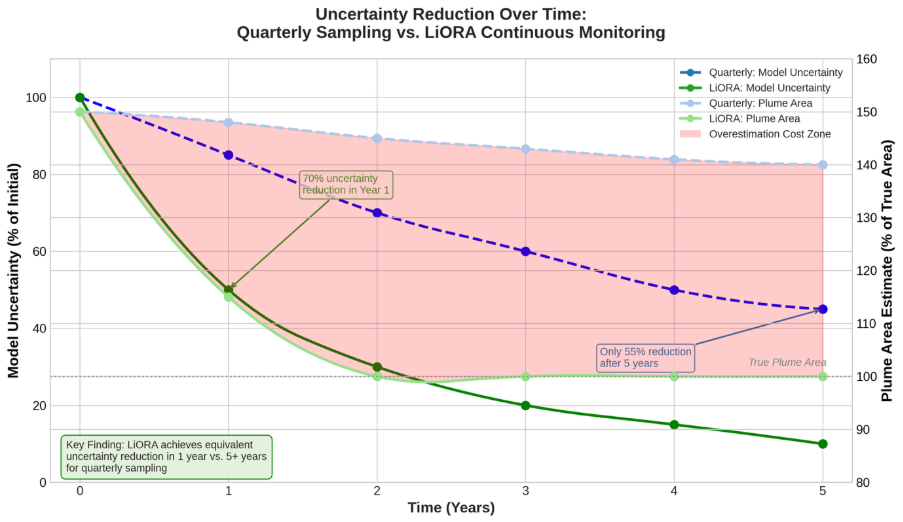
The shaded region between the quarterly and continuous monitoring curves in Figure 2 represents cumulative overestimation cost, the price paid for relying on conservative estimates when accurate estimates are achievable.
This cost includes:
The peer-reviewed literature points toward clear recommendations for site managers seeking accurate plume characterisation at reasonable cost.
Upgrade from quarterly to continuous monitoring using autonomous sensors that measure contaminant concentrations directly, providing the data density that data assimilation methods require. This upgrade should prioritise locations where plume boundaries are uncertain or where remediation decisions depend on accurate concentration estimates.
The cost comparison favours continuous monitoring, making this upgrade a matter of implementation rather than budget justification.
Implement data assimilation frameworks that update parameter estimates as new measurements arrive, replacing the static calibration approaches that lock in initial assumptions regardless of subsequent observations.
Platforms like LiORA Trends provide turnkey implementation of these methods, eliminating the need for in-house development of sophisticated algorithms. The result is models that improve as data accumulates rather than remaining anchored to initial guesses.
Use statistical trend analysis for its appropriate purpose: understanding and documenting historical patterns rather than predicting future behaviour. Mann-Kendall tests and related methods provide valuable evidence for regulatory compliance demonstrations based on documented concentration trends.
However, these methods should not be relied upon for projecting future conditions at sites undergoing remediation or experiencing changing conditions. Process-based models with data assimilation should be used for forward-looking predictions.
Quantify and communicate uncertainty explicitly rather than hiding it behind conservative single-value estimates that provide false precision. Uncertainty ranges should accompany all predictions, enabling decision-makers to understand the confidence that should be placed in model outputs.
In 2020(16), Hunt, Fienen, and White revisited one of the earliest attempts at fitting numerical models to observations, Freyberg, 1988(17), to capture the shift in thinking that has occurred as data assimilation methods have matured and continuous monitoring has become feasible.
They wrote that today's groundwater modelling efforts should put forecasts first with uncertainty quantification central to all phases, rather than treating uncertainty as an afterthought addressed only when reviewers demand it.
The goal is not to build perfect models, which is impossible given subsurface complexity, but to build models that improve as data accumulates and that honestly communicate remaining uncertainty. The research available at https://doi.org/10.1111/gwat.12907 provides comprehensive guidance for implementing this approach.
LiORA prevents systematic overestimation by replacing conservative parameter defaults with data-constrained estimates. Continuous sensor measurements feed data assimilation algorithms that reduce model uncertainty by up to 70% and enable accurate plume delineation in a fraction of the time required by traditional quarterly sampling.
Three decades of hydrogeological research have documented a consistent pattern that explains why most contaminated sites suffer from plume overestimation:
The question for site managers is straightforward: How much are you spending on remediation that your plume does not actually require, and how many years are you waiting for site closure based on plume boundaries that were never accurate?
The peer-reviewed evidence suggests that most sites suffer from significant overestimation, with remediation programs treating groundwater that was never contaminated and monitoring networks extending into areas beyond actual impact.
The technology now exists to answer these questions with data rather than guesswork, providing accurate plume characterisation for less cost than traditional approaches.
Continuous groundwater monitoring provides 17,520 data points per year compared to 4 from quarterly sampling, enabling data assimilation algorithms to reduce model uncertainty by up to 70% within the first year. This high data density makes it possible to constrain model parameters using actual site observations rather than conservative defaults that systematically overestimate plume extent.
Continuous monitoring also detects contamination events within 30 minutes rather than up to 90 days with quarterly sampling, enabling rapid response that limits plume expansion. The cost of $5,000 per sensor per year is 17% less than traditional quarterly sampling while providing vastly more information.
Traditional methods rely on quarterly grab samples analysed in laboratories, providing 4 data points per year that cannot adequately constrain model parameters and force reliance on conservative defaults. LiORA uses autonomous sensors deployed in monitoring wells that measure every 30 minutes, generating 17,520 data points per year that enable data-driven parameter estimation through ensemble Kalman filter methods.
Traditional statistical tools like GWSDAT analyze historical patterns and should not be used to predict future behaviour, whereas LiORA Trends maintains physics-based predictions that remain valid when conditions change due to remediation or other interventions.
Traditional models require parameter values for hydraulic conductivity, dispersivity, and reaction rates that cannot be measured directly at model scales and must be inferred from observations of system behaviour. With only 4 data points per year from quarterly sampling, there is insufficient information to constrain these parameters, forcing practitioners to substitute conservative software defaults that overestimate rate parameters by a factor of 2 on average.
These overestimated parameters produce predictions of faster transport and larger plumes than actually exist in the subsurface, leading to remediation programs that treat areas beyond actual contamination extent.
Data assimilation is a mathematical framework for systematically updating model parameters as new observations become available, combining the physical understanding embedded in process-based models with the site-specific information contained in monitoring data.
Methods like the Ensemble Kalman Filter compare model predictions to sensor measurements and adjust parameters to reduce the difference between predicted and observed values, maintaining parameter distributions that represent remaining uncertainty. This process runs continuously as new data arrives, progressively replacing conservative defaults with data-constrained values that accurately represent site conditions.
Traditional quarterly sampling costs approximately $6,000 per well per year when all costs are properly accounted, including mobilisation, purging, sample collection, shipping, laboratory analysis, data validation, and reporting that together constitute the full cost of obtaining four data points annually.
LiORA Sensors cost $5,000 per sensor per year, covering continuous measurement every 30 minutes, wireless data transmission, automated quality assurance, and platform access for analysis and visualisation. This means LiORA provides 4,380 times more data for 17% less cost, improving both the economics and the accuracy of site characterisation simultaneously.
LiORA Sensors measure petroleum hydrocarbon concentrations directly, providing the specific contaminant data needed for transport modelling and regulatory compliance at fuel retail sites, refineries, terminals, and industrial facilities where petroleum hydrocarbons are the primary contaminants of concern. We also measure chloride concentrations directly, working with facilities, retail sites, water stations, and refineries where chloride are the primary contaminants of concern.
The sensors provide real-time concentration measurements that feed data assimilation algorithms, enabling continuous parameter updating that improves model accuracy over time as observations accumulate.
Peer-reviewed research shows 70% uncertainty reduction within one year of subhourly monitoring, a dramatic improvement that would require decades to achieve with quarterly sampling if it could be achieved at all. Plume area estimates typically converge to true values within two years as the data assimilation process progressively replaces conservative defaults with data-constrained parameters.
Compare this to the 5+ years required to achieve equivalent statistical confidence with quarterly sampling, which still cannot correct the systematic bias from conservative parameter defaults.
Continuous monitoring data is increasingly accepted by regulatory agencies as the technology matures and case studies demonstrate its reliability for compliance applications. LiORA works with clients to ensure data formats, quality assurance protocols, and reporting structures meet the specific requirements of relevant regulatory programs.
Early engagement with regulators during program design helps ensure that continuous monitoring data will be accepted for intended compliance applications. The documented cost savings and improved accuracy typically build regulatory support for innovative monitoring approaches.
Well influence analysis identifies which monitoring wells contribute critical versus redundant information to plume characterisation, enabling optimisation of monitoring networks to eliminate unnecessary sampling while preserving information essential for accurate site understanding.
Some wells anchor the model, providing irreplaceable constraints on plume geometry that cannot be obtained from other locations. Others contribute marginally, their information largely redundant with neighbouring wells such that their removal would not significantly affect plume characterisation accuracy. LiORA Trends provides automated well influence analysis with reports delivered within three days of data upload.
Site closure requires demonstrating that contamination is stable or declining and that concentrations meet applicable standards. Quarterly sampling requires 5+ years to establish statistically significant trends due to the limited information content of sparse data and the high variability typical of groundwater concentration measurements.
Continuous monitoring achieves equivalent statistical confidence in 1 to 2 years by providing the data density needed for robust trend detection even in high-variance systems. Additionally, accurate plume delineation prevents over-remediation of areas that were never actually contaminated, reducing both the cost and the timeline required to achieve closure conditions.
Contact LiORA to learn how data assimilation with continuous monitoring can eliminate systematic plume overestimation and reduce your remediation costs.
Website: www.joinliora.com

As CEO of LiORA, Dr. Steven Siciliano brings his experience as one of the world’s foremost soil scientists to the task of helping clients to efficiently achieve their remediation goals. Dr. Siciliano is passionate about developing and applying enhanced instrumentation for continuous site monitoring and systems that turn that data into actionable decisions for clients.