Every groundwater monitoring network includes wells that cost money but provide no commensurate value. This statement reflects reality at contaminated sites worldwide, not a criticism of the hydrogeologists who designed these networks.
Contamination plumes evolve over time, and our understanding of subsurface conditions improves as data accumulates. A well that provided critical information during initial site characterization may become redundant as the plume stabilizes, while a well installed based on conservative assumptions about contaminant transport may prove to be outside the actual zone of impact.
I think about this problem constantly, watching site managers struggle with monitoring budgets while suspecting that some portion of their sampling effort produces waste. The peer reviewed literature confirms this suspicion. Wu, Zheng, and Chien (2005)(1) noted in the Journal of Contaminant Hydrology that over sampling occurs at contaminated sites, with facilities collecting several hundred samples per year at costs reaching hundreds of thousands of dollars.
It is shown that potential cost savings up to 65.6% may be achieved without any significant loss of accuracy in mass and moment estimations. Wu et al. 2005
The research available at https://doi.org/10.1016/j.jconhyd.2004.11.006 documents this pattern across multiple site types.
Long term monitoring programs extend thirty years or more at most contaminated sites. The cumulative expense of sampling redundant wells across such timeframes reaches into the millions of dollars. Reed, Minsker, and Valocchi (2000)(2) demonstrated in Water Resources Research that genetic algorithm optimization could reduce sampling costs by up to 60 percent without loss in accuracy of global mass estimates.
Their findings, available at https://doi.org/10.1029/2000WR900232, established that the savings potential exceeds what most site managers assume.
The question facing site managers is not whether your network contains redundant wells. The question is which wells provide redundant information, and how much they cost your organization.
Answering this question requires tools and methodologies that can quantify the information contribution of individual monitoring locations. Such tools now exist, enabling data driven decisions about network optimization that replace intuition with evidence.
Understanding which monitoring wells provide critical versus redundant information requires a shift in how we think about groundwater data. Traditional approaches treat each well as an independent sampling point. Site managers collect samples, analyze them, plot the results, and make decisions based on the data. This conceptual model fails to account for the spatial relationships between monitoring locations.
Wells do not exist in isolation within the subsurface. Each measurement provides information not just about conditions at that specific location, but about conditions throughout the surrounding aquifer. The degree to which one well provides information that overlaps with another determines whether both monitoring locations remain necessary.
When two wells sample similar portions of the plume under similar hydrogeologic conditions, their data contain redundant information.
Contamination plumes that migrate during the early years of a release tend to stabilize as natural attenuation processes establish equilibrium with source loading. A stabilized plume requires different monitoring than an expanding plume.
Wells installed to track plume migration become less informative once the plume stops moving. Wells positioned to characterize plume edges contribute less once those boundaries remain static across multiple sampling events.
The cost of redundant sampling compounds over time because monitoring networks rarely undergo systematic review. Wells added during site characterization remain in monitoring programs years after they stopped providing unique information.
Each quarterly sampling event generates costs for wells that could be removed without affecting the quality of site understanding. These accumulated costs represent the opportunity cost of failing to optimize.
Radvanyi (2025) formalized the concept of well influence analysis in his doctoral thesis at the University of Glasgow, building on earlier work by Evers and colleagues (2015)(3) at https://doi.org//10.1002/env.2347.
Using spatiotemporal statistical models, he demonstrated that the influence of individual wells on estimated concentration surfaces varies across a monitoring network. Some wells anchor the model, providing constraints on plume geometry and behavior that cannot be replaced. Others contribute marginally, their information largely redundant with neighboring wells.
Well influence analysis uses statistical metrics from regression theory to quantify how much each monitoring location affects model predictions. Metrics like Cook's distance, leverage values, and DFFITS measure the effect of removing individual observations on model estimates.
Radvanyi demonstrated that averaging these metrics across all observations from a single well provides a ranking of well importance. The research, published in the proceedings of the 37th International Workshop on Statistical Modelling(4), achieved 73 to 77 percent accuracy in approximating full cross validation rankings.
The traditional approach to well influence analysis involves well based cross validation, where each well is removed from the dataset and the resulting change in model predictions is measured. If removing a well increases prediction errors, that well provides unique information. If predictions remain stable, the well may be redundant.
This approach requires fitting the statistical model n times for a network of n wells. For networks with dozens or hundreds of wells, this computation becomes prohibitive.
Influence metrics from a single model fit can approximate well based cross validation rankings without the computational burden. By calculating leverages and related statistics from one analysis, wells can be ranked by influence in a fraction of the time required for iterative cross validation.
This acceleration enables practical application of optimization methodologies at sites where the full cross validation approach would require days or weeks of processing.
The history of groundwater network optimization reflects the broader evolution of environmental data analysis. Early efforts relied on professional judgment. Experienced hydrogeologists would examine contour maps, review concentration trends, consider groundwater flow directions, and recommend which wells to retain or eliminate.
This approach works when networks contain few wells and plumes display simple geometries. It scales poorly as complexity increases.
As networks grow and plume geometries become complex, the number of potential well combinations exceeds what humans can evaluate intuitively:
No hydrogeologist, regardless of experience, can mentally evaluate more than a fraction of these possibilities. The judgment based approach fails not from lack of expertise but from the mathematical impossibility of considering all options.
Software tools emerged to address the limitations of judgment based optimization. GWSDAT, the Groundwater Spatiotemporal Data Analysis Tool developed through collaboration between the University of Glasgow and Shell Global Solutions, introduced well redundancy analysis as a feature in version 3.1.
Jones et al. (2022)(5) described these capabilities in Groundwater Monitoring and Remediation, with the full publication available at https://doi.org/10.1111/gwmr.12522. Users could manually remove one or multiple wells from their dataset and recompute concentration surfaces to assess impact.
The influence metrics approach described by Radvanyi now operates within GWSDAT, providing practitioners with automated rankings that identify candidates for further investigation.
This represents a shift from manual trial and error to systematic evaluation. Site managers receive a ranked list of wells ordered by their information contribution rather than spending hours testing different well subsets. The time savings enable more thorough analysis and faster decision making.
Modern well influence analysis rests on spatiotemporal statistical models that account for both the spatial distribution of monitoring wells and the temporal patterns in concentration data.
P-spline models, as implemented in GWSDAT, create smooth concentration surfaces that interpolate between monitoring locations while capturing how those surfaces change over time. The model structure enables calculation of influence metrics that reflect both spatial and temporal contributions.
Evers et al. (2015)(3) developed the P-spline modeling framework now used for groundwater quality analysis. Their Bayesian approach fits smooth surfaces to concentration observations while quantifying uncertainty in predictions.
The method handles the irregular sampling locations and varying measurement times common in groundwater monitoring data. Each well's contribution to the fitted surface can be assessed through standard influence diagnostics.
Leverage measures how unusual a monitoring well's location is relative to other wells in the network. Wells in isolated positions have higher leverage because no other wells constrain predictions in their vicinity.
Influence statistics combine leverage with residual information to quantify how much removing a well would change model predictions. Wells with high influence cannot be removed without affecting the accuracy of concentration estimates.
Statistical rankings provide a starting point for optimization decisions, not a final answer. Wells flagged as low influence warrant investigation to determine whether they can be removed safely.
This investigation must consider factors beyond the statistical analysis, including regulatory requirements, physical access constraints, and areas of specific concern. The statistics enable the conversation by identifying candidates for detailed review.
Site managers often hesitate to propose network changes due to concerns about regulatory response. This hesitation frequently proves unfounded. Regulators respond positively to optimization proposals that demonstrate analytical rigor and maintain adequate monitoring coverage.
Proposals backed by quantitative influence analysis, sensitivity testing, and clear rationale for retained wells typically receive approval without protracted negotiations.
Successful optimization proposals include documentation of:
This documentation transforms optimization from a cost cutting exercise into a data driven decision.
Regulatory frameworks for long term monitoring recognize that information needs change as sites progress toward closure. Wells necessary during active remediation may become redundant during natural attenuation phases.
Optimization is not a one time event but an ongoing process that should be revisited as site conditions evolve. Periodic reassessment of network efficiency represents best practice for responsible site stewardship.
Optimizing a groundwater monitoring network involves more than identifying wells to eliminate. It requires developing a coherent sampling strategy that balances information value against cost across all aspects of the monitoring program.
Hosseini and Kerachian (2017)(6) combined statistical criteria with value of information concepts to identify monitoring locations of varying priority, recognizing that some wells warrant more frequent sampling while others could be sampled less frequently.
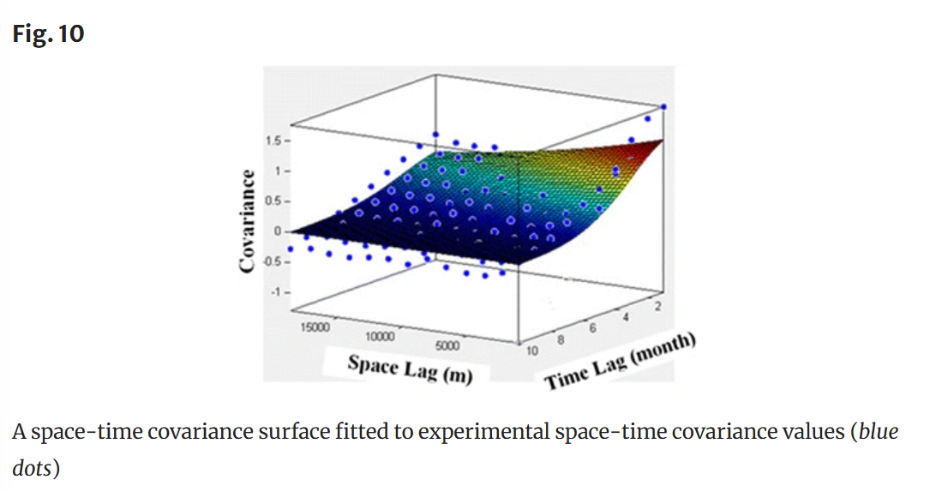
The core essence of this idea is that the concentration observed in a well is correlated with what was observed previously. Thus, we should only measure wells when the correlation between present and prior observations is at its minimum. Their research combined the space and time covariance that occurs during monitoring.
You can find their work at https://doi.org/10.1007/s10661-017-6129-6 provides a framework for comprehensive optimization.
McHugh et al. (2016)(7) addressed the question of monitoring frequency versus monitoring duration in Groundwater journal. Their research at https://doi.org/10.1111/gwat.12407 demonstrates that extending monitoring duration while reducing sampling frequency can provide equivalent or better statistical confidence in trend detection.
A site sampled quarterly for ten years may generate less useful trend information than a site sampled semi annually for fifteen years. Optimizing frequency as well as well selection compounds the cost savings.
Van der Spek and Bakker (2017)(8) examined the relationship between calibration period length and model reliability in Water Resources Research. Their findings, available at https://doi.org/10.1002/2016WR019704, indicate that the required length of the calibration period relates to the decay time of system noise rather than simply the response time.
Longer calibration periods with fewer observations can outperform shorter periods with more observations under many conditions. This finding supports strategic reduction of sampling frequency at appropriate sites.
Optimal sampling depends on site specific context. A well that appears redundant when considering only spatial coverage may provide critical temporal information about plume dynamics. A well that seems unnecessary under stable conditions may become essential if the plume begins to migrate.
Effective network optimization must account for both spatial and temporal dimensions of the monitoring problem and must be revisited as conditions change.
Manual well analysis and even automated influence rankings based on historical data provide snapshots of current redundancy. They do not inherently account for future scenarios or changing plume behavior.
A well identified as redundant today may become critical if hydrogeologic conditions shift. Traditional approaches optimize for past conditions rather than anticipated future needs. This backward looking orientation limits their value for long term planning.
Quarterly sampling generates four data points per year from each monitoring location. This sparse temporal resolution prevents detection of short term fluctuations in groundwater quality. Seasonal variations, episodic releases, and transient plume behavior remain invisible between sampling events.
Wells identified as redundant based on quarterly data may appear more valuable if sampled at higher frequency. The data limitations constrain the analysis.
A comprehensive sampling strategy requires integration of statistical analysis with process understanding. Empirical patterns in the data must be combined with physical models of contaminant transport to anticipate future information needs.
This integration proves difficult when statistical tools operate independently of flow and transport models. The disconnect between analysis tools and physical understanding limits optimization quality.
Most optimization tools look backward at historical data rather than forward at anticipated plume evolution. They identify which wells provided redundant information in the past without assessing which wells will provide redundant information in the future.
This gap matters because the goal of optimization is to improve future monitoring efficiency, not to document past inefficiency. Forward looking analysis requires predictive capabilities that traditional tools lack.
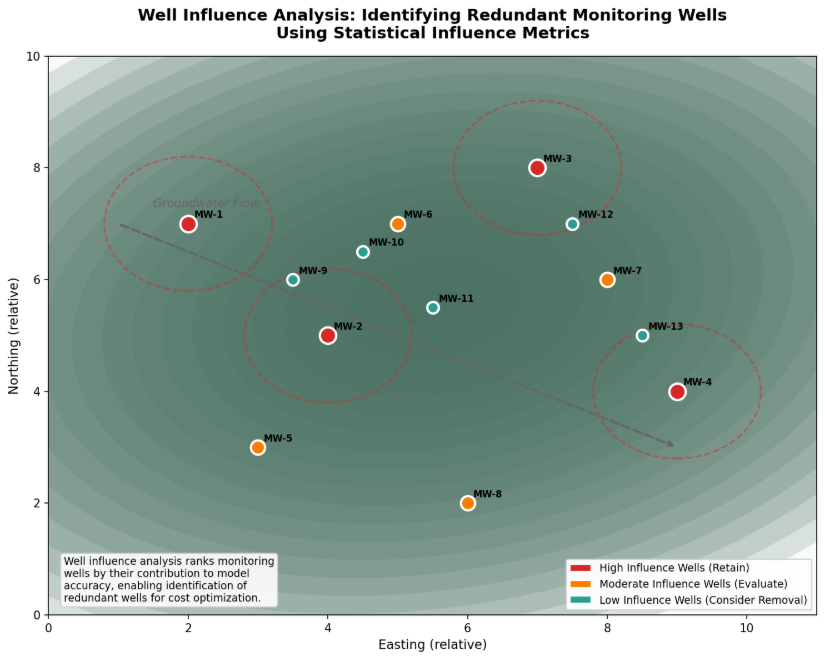
This visualization demonstrates how well influence analysis categorizes monitoring wells based on their contribution to model accuracy. Wells with high influence (red) provide unique information that cannot be replaced. Wells with low influence (green) provide redundant information and represent candidates for removal from the monitoring network.
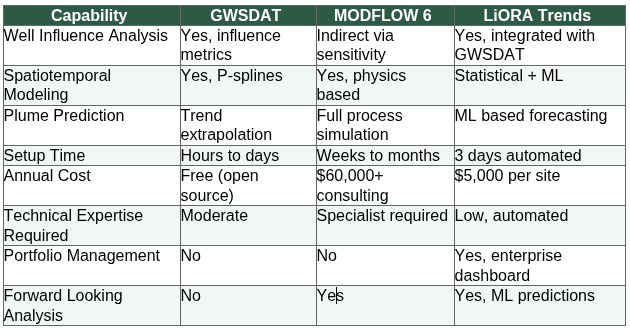
Understanding the strengths and limitations of available tools for well influence analysis and network optimization requires examining how different approaches handle the core challenges of the problem. Three frameworks merit attention: GWSDAT for statistical analysis, MODFLOW 6 for numerical modeling, and integrated platforms like LiORA Trends that bridge these methodologies.
GWSDAT represents the state of the art in spatiotemporal statistical analysis of groundwater monitoring data. Its P-spline modeling framework, developed by Evers and colleagues (2015)(3), provides a method for estimating concentration surfaces from sparse well networks.
The well redundancy analysis feature, enhanced with influence metric based rankings following Radvanyi's work(4), enables practitioners to identify redundant wells and provide quantitative justification. GWSDAT operates as open source software, freely available at http://gwsdat.net and widely adopted by groundwater professionals.
The limitations of GWSDAT include:
GWSDAT identifies statistical redundancy but users must integrate GWSDAT results with hydrogeologic understanding to make informed decisions. The tool provides analysis but not complete decision support.
MODFLOW 6 provides a framework for simulating groundwater flow physics. When calibrated against site data, MODFLOW models can predict how plumes will evolve under various scenarios, enabling stress testing of network optimization decisions.
The tool represents the standard for numerical groundwater modeling in North America and enjoys broad acceptance among regulators. Documentation and model files are available through the USGS at https://www.usgs.gov/software/modflow-6-usgs-modular-hydrologic-model.
The limitation of MODFLOW 6 is accessibility. Building, calibrating, and running MODFLOW models requires hydrogeologic expertise and time investment. Modeling projects cost $60,000 or more and take months to complete.
This expense and timeline may be justified for complex sites but represent a barrier for routine optimization applications. Most sites cannot justify the investment required for numerical model development solely to support network optimization.
For sites with straightforward hydrogeology and stable plumes, GWSDAT provides sufficient analysis to identify wells that appear redundant. The free availability of the software makes it accessible to any site manager willing to invest time in learning the interface.
The influence metrics feature generates rankings that can inform initial decisions about network optimization without additional cost.
For sites requiring rigorous defense of optimization decisions or facing complex hydrogeologic conditions, more analysis may be warranted. MODFLOW modeling provides the physical basis for predicting how plume evolution will affect future monitoring needs.
The investment in numerical modeling pays off when optimization decisions must withstand regulatory scrutiny or when site conditions demand process based understanding.
LiORA Trends represents an attempt to integrate statistical and predictive approaches within a more accessible platform. By incorporating GWSDAT's spatiotemporal analysis framework alongside machine learning based forecasting, LiORA Trends enables well influence analysis that accounts for both statistical patterns in the data and anticipated future conditions.
Machine learning models predict plume evolution over time, providing forward looking context for network optimization decisions.
For site managers facing immediate budget pressures, the theoretical elegance of optimization frameworks matters less than practical results. The question is not whether network optimization is possible, but how fast it can be accomplished and with what confidence in the recommendations.
Traditional consulting engagements for network optimization require weeks or months of analysis time. During this period, sampling continues at existing frequencies and costs accumulate.
The computational efficiency gains from influence metric approaches have made rapid assessment feasible. Where well based cross validation might require days or weeks of processing for large networks, influence based rankings can be generated in hours.
This acceleration enables iterative analysis, in which preliminary rankings can be refined based on additional considerations such as regulatory requirements, physical access constraints, or concerns about specific areas of the plume.
Platforms like LiORA Trends offer three day turnaround for well influence analysis, addressing a genuine practical barrier:
The result is faster decision making and earlier realization of cost savings.
For organizations managing portfolios of multiple sites, the ability to evaluate network optimization opportunities across all sites simultaneously can identify the highest value targets for detailed attention.
Rather than optimizing sites one at a time based on which consultant becomes available, portfolio managers can prioritize optimization efforts based on quantitative assessment of savings potential. This systematic approach maximizes return on optimization investment.
Equally important as the speed of analysis is the ability to defend optimization decisions to regulators, stakeholders, and internal management. Quantitative analysis provides the documentation needed for defensible recommendations.
Rather than stating that a hydrogeologist believes certain wells are redundant, site managers can demonstrate through statistical analysis that specific wells contribute minimal unique information to the monitoring network.
Influence rankings provide statistical evidence that can be presented to regulators alongside conventional site maps and data summaries. The metrics quantify what might otherwise be a judgment call.
A well with influence rank of 18 out of 20 can be characterized as contributing less than 10 percent of the network's total information content. This quantification supports proposals to remove or reduce sampling frequency at low influence wells.
Robust optimization proposals include sensitivity analysis showing how recommendations would change under different assumptions:
By demonstrating that recommendations remain valid under plausible alternative scenarios, site managers build confidence in optimization decisions. This analysis requires predictive capabilities that link statistical optimization to physical understanding.
Long term monitoring programs at contaminated sites face audit requirements from regulators, corporate compliance, and potentially legal proceedings. Optimization decisions must be documented in ways that can withstand future scrutiny.
The analysis files, influence rankings, and decision rationale need to be preserved as part of the site record. Automated platforms that generate standardized documentation simplify compliance with these requirements.
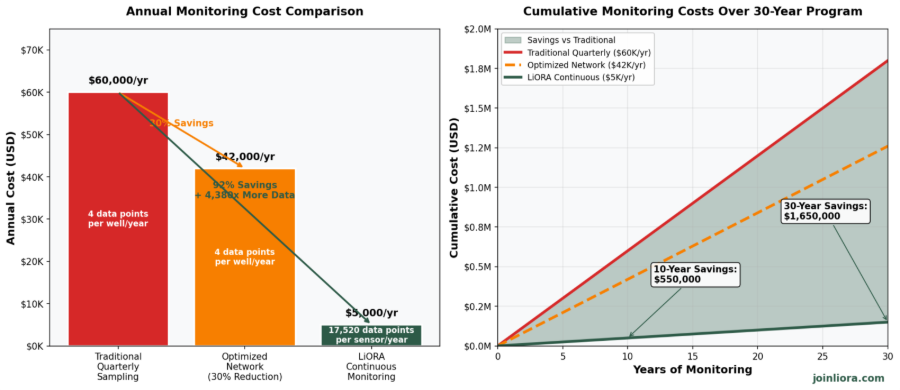
This figure compares annual monitoring costs and cumulative expenditure over a 30-year monitoring program. Traditional quarterly sampling costs approximately $60,000 per year. Network optimization can reduce costs by 30 percent through well reduction. LiORA continuous monitoring provides 4,380 times more data while costing 92 percent less than traditional approaches.
LiORA Trends transforms groundwater monitoring data into actionable information for site management decisions. The platform incorporates:
The well influence analysis feature in LiORA Trends implements the Radvanyi methodology for ranking monitoring wells by their contribution to model accuracy. Users upload their monitoring data and receive ranked lists of wells within three days.
The rankings identify which wells provide critical information and which wells contribute redundant data. This analysis supports informed decisions about network optimization without requiring specialized statistical expertise.
LiORA Trends accepts data uploads from standard formats used in groundwater monitoring. The platform performs automated quality control checks to identify potential data issues before analysis.
This automation eliminates the manual data handling steps that consume consultant time and introduce opportunities for error. Sites can be analyzed within days of data receipt rather than weeks or months required for traditional consulting engagements.
Machine learning models within LiORA Trends predict how contaminant plumes will evolve over time, providing the forward looking context missing from statistical tools that analyze only historical data.
These predictions enable assessment of whether wells identified as currently redundant will remain redundant as plume conditions change. The predictive capability transforms network optimization from a backward looking exercise into forward looking strategy development.
LiORA Sensors provide autonomous, continuous measurement of groundwater contaminant concentrations. The sensors are deployed directly in monitoring wells where they operate without manual intervention, measuring every 30 minutes throughout the year.
This measurement frequency generates 17,520 data points per year from each sensor location compared to four data points from quarterly sampling. The autonomous operation eliminates mobilization costs and scheduling constraints that limit traditional sampling programs.
LiORA Sensors measure petroleum hydrocarbon concentrations directly, providing the contaminant data needed for transport modeling and regulatory compliance at fuel retail sites, refineries, terminals, and industrial facilities.
Direct measurement of contaminant concentrations feeds data assimilation algorithms that update model parameters continuously. The sensors transmit data wirelessly to the LiORA Trends platform where it is automatically quality checked and incorporated into site models.
LiORA Sensors cost $5,000 per sensor per year, covering:
Traditional quarterly sampling costs approximately $6,000 per well per year when all costs are properly accounted, including mobilization, purging, sample collection, shipping, laboratory analysis, data validation, and reporting.
LiORA provides 4,380 times more data for 17 percent less cost.
Continuous monitoring data from LiORA Sensors provides the temporal resolution needed for high quality well influence analysis. The 17,520 data points per year reveal patterns invisible in quarterly sampling data.
Wells that appear influential based on quarterly data may prove redundant when analyzed with continuous data. Conversely, wells that appear redundant may show value when temporal patterns become visible. This integration of continuous monitoring with influence analysis enables more accurate network optimization.

LiORA Trends costs $5,000 to $7,000 per site per year for the analysis platform. This pricing includes:
Current discounts apply to five site packages. The annual cost for five sites compares favorably to a single MODFLOW modeling project while providing ongoing analysis rather than a one time assessment.
The value proposition of LiORA solutions rests on three pillars:
These capabilities combine to reduce monitoring costs while improving data quality.
Implementation begins with assessment of the current monitoring network. Site managers should compile:
This inventory provides the foundation for optimization analysis. The data requirements for well influence analysis include concentration measurements from multiple sampling events across the monitoring period. More data enables more robust analysis.
Tool selection depends on site complexity, available budget, and timeline constraints:
For straightforward sites:
For complex sites:
Once data are assembled and tools selected, the analysis proceeds through:
The output identifies wells that contribute minimal unique information to the monitoring network. These wells represent candidates for removal or reduced sampling frequency. The analysis also identifies wells that must be retained because they provide information that cannot be replaced by other locations.
Optimization proposals translate analysis results into actionable recommendations. The proposal should identify:
This documentation supports regulatory review and provides an audit trail for future reference.
Successful optimization proposals often involve pre submission consultation with regulatory agencies. This consultation allows site managers to:
Regulators generally respond positively to data driven optimization proposals that maintain adequate monitoring coverage.
Regulatory agencies expect documentation that demonstrates the technical basis for optimization recommendations. This documentation should include:
The documentation standards vary by agency but generally emphasize transparency and scientific rigor.
Most regulatory frameworks include provisions for modifying monitoring programs based on site specific conditions. These provisions recognize that monitoring needs change as sites progress from active remediation to natural attenuation to closure.
Optimization proposals fit within these established pathways. Site managers should work with their regulatory contacts to identify the appropriate approval mechanism for their jurisdiction.
Network optimization is not a one time event but an ongoing process. Sites should establish periodic review schedules to reassess network efficiency as conditions evolve.
Changes in plume behavior, regulatory requirements, or site use may warrant reconsideration of previous optimization decisions. Automated platforms that continuously analyze monitoring data can flag conditions that suggest the need for network reassessment.
Success of network optimization should be tracked through ongoing measurement of monitoring costs. Site managers should compare pre optimization and post optimization costs across all relevant categories:
The savings should be documented as part of the site record and reported to stakeholders who approved the optimization.
Cost reduction should not come at the expense of data quality. Site managers should monitor key performance indicators for the optimized network:
If data quality metrics decline following optimization, the network should be reassessed to determine whether additional monitoring locations are needed.
Network optimization represents one component of a broader continuous improvement approach to site management. Lessons learned from optimization should inform future decisions about network design, sampling frequency, and data analysis.
Sites that establish feedback loops between optimization results and operational decisions achieve compounding benefits over time.
Organizations managing multiple sites can aggregate lessons learned across their portfolio. Optimization approaches that succeed at one site can be applied to similar sites.
Portfolio level reporting enables identification of best practices and systematic improvement across all monitored locations. This organizational learning multiplies the value of optimization investments.
Whatever tools are employed, the fundamental principle remains: not all monitoring wells contribute equally to our understanding of contamination.
Some provide critical constraints on plume behavior. Others generate data that duplicates information available from neighboring wells. Distinguishing between these categories and making defensible decisions about where to reduce sampling effort is essential for sustainable long term monitoring programs.
The tools now exist to make these distinctions quantitatively rather than intuitively:
The technological barriers to network optimization have largely been eliminated.
The savings await those willing to apply these tools:
These savings can be redirected to more productive uses including accelerated remediation, stakeholder engagement, or simply return to organizational budgets.
Site managers facing budget pressures have an obligation to evaluate whether their monitoring networks operate efficiently. The question is not whether redundant wells exist in your network. The question is which wells are redundant and how much they cost.
The tools to answer this question are available. The documented savings are substantial. The path forward is clear.
Visit joinliora.com to learn how LiORA Trends can identify cost savings through well influence analysis in three days.
Well influence analysis is a statistical method for ranking monitoring wells by their contribution to model accuracy. The method uses influence metrics from regression analysis to quantify how much each monitoring location affects concentration estimates across a site.
Wells with high influence provide unique information that cannot be replaced by other monitoring locations. Wells with low influence provide information that largely duplicates data from neighboring wells and represent candidates for removal from the monitoring network.
The analysis calculates statistical metrics including leverage values, Cook's distance, and DFFITS for each monitoring observation. These metrics measure the effect of removing individual data points on model predictions.
By averaging the metrics across all observations from a single well, the analysis generates a ranking of wells by their overall information contribution. Wells at the bottom of this ranking contribute minimal unique information and represent candidates for removal or reduced sampling frequency.
Continuous monitoring provides 4,380 times more data than quarterly sampling by measuring concentrations every 30 minutes rather than every 90 days. This data density enables:
Continuous monitoring also eliminates mobilization costs and enables real-time response rather than discovering changes months after they occur.
Traditional quarterly sampling costs approximately $6,000 per well per year when all costs are properly accounted, including mobilization, purging, sample collection, shipping, laboratory analysis, data validation, and reporting.
A 10 well network costs approximately $60,000 per year under traditional sampling. LiORA Sensors cost $5,000 per sensor per year for continuous monitoring that provides 17,520 data points annually. LiORA Trends costs $5,000 to $7,000 per site per year for analysis platform access.
Traditional monitoring relies on quarterly sampling that provides four data points per year from each well. Between sampling events, site conditions remain unknown.
LiORA Sensors measure continuously, providing 17,520 data points per year from each location. LiORA Trends combines statistical analysis with machine learning prediction, enabling both backward looking trend detection and forward looking plume forecasting. This integration provides decision support that traditional statistical tools cannot match.
Traditional consulting engagements for network optimization require weeks or months of analysis time. LiORA Trends provides well influence analysis with three day turnaround from data upload to ranked results.
This acceleration reflects automated data import, standardized analysis workflows, and cloud computing resources that eliminate the bottlenecks in traditional consulting approaches. The rapid turnaround enables iterative analysis and faster decision making.
Yes. Peer reviewed research by Reed, Minsker, and Valocchi (2000)(2) demonstrated cost reductions of up to 60 percent through genetic algorithm optimization of monitoring networks. EPA demonstration projects documented savings of 29 to 51 percent across case study sites.
The actual savings at any specific site depend on the degree of redundancy in the current network, but most sites contain optimization opportunities that can reduce costs by at least 30 percent while maintaining adequate monitoring coverage.
Regulators generally respond positively to optimization proposals that demonstrate analytical rigor and maintain adequate monitoring coverage. Proposals backed by quantitative influence analysis, sensitivity testing, and clear rationale for retained wells typically receive approval.
Most regulatory frameworks include provisions for modifying monitoring programs based on site specific conditions. Pre submission consultation with regulatory agencies can help identify documentation requirements and build support for proposed changes.
LiORA Sensors measure petroleum hydrocarbon concentrations directly, providing the contaminant data needed for transport modeling and regulatory compliance at fuel retail sites, refineries, terminals, and industrial facilities where petroleum hydrocarbons are the primary contaminants of concern. We can also measure chloride concentrations directly, providing the crucial data needed for refineries, industrial, upstream, andwater stations where chlorides are the primary comtaminant of concern.
The sensors provide real time concentration measurements that feed data assimilation algorithms enabling continuous parameter updating. Direct measurement eliminates interpretation uncertainty associated with surrogate parameters.
LiORA Trends uses:
Upon data upload, the platform performs quality control checks, fits spatiotemporal models to the concentration data, calculates influence metrics for all monitoring wells, and generates ranked lists identifying redundant wells as candidates for removal.
The three day turnaround enables rapid optimization decisions rather than waiting months for traditional consulting analysis.
(1) Wu, J.; Zheng, C.; Chien, C. Cost-effective sampling network design for contaminant plume monitoring under general hydrogeological conditions. JOURNAL OF CONTAMINANT HYDROLOGY 2005, 77 (1-2), 41-65. DOI: 10.1016/j.jconhyd.2004.11.006.
(2) Reed, P.; Minsker, B.; Valocchi, A. Cost-effective long-term groundwater monitoring design using a genetic algorithm and global mass interpolation. WATER RESOURCES RESEARCH 2000, 36 (12), 3731-3741. DOI: 10.1029/2000WR900232.
(3) Evers, L.; Molinari, D.; Bowman, A.; Jones, W.; Spence, M. Efficient and automatic methods for flexible regression on spatiotemporal data, with applications to groundwater monitoring. ENVIRONMETRICS 2015, 26 (6), 431-441. DOI: 10.1002/env.2347.
(4) Radvanyi, P.; Claire, M.; Craig, A.; Low, M.; Jones, W. R. Computationally Efficient Ranking of Groundwater Monitoring Locations. In Proceedings of the 37th International Workshop on Statistical Modelling (IWSM): 332-338, 2023.
(5) Jones, W.; Rock, L.; Wesch, A.; Marzusch, E.; Low, M. Groundwater Spatiotemporal Data Analysis Tool: Case Studies, New Features and Future Developments. GROUND WATER MONITORING AND REMEDIATION 2022, 42 (3), 14-22. DOI: 10.1111/gwmr.12522.
(6) Hosseini, M.; Kerachian, R. A Bayesian maximum entropy-based methodology for optimal spatiotemporal design of groundwater monitoring networks. ENVIRONMENTAL MONITORING AND ASSESSMENT 2017, 189 (9). DOI: 10.1007/s10661-017-6129-6.
(7) McHugh, T.; Kulkarni, P.; Newell, C. Time vs. Money: A Quantitative Evaluation of Monitoring Frequency vs. Monitoring Duration. GROUNDWATER 2016, 54 (5), 692-698. DOI: 10.1111/gwat.12407.
(8) van der Spek, J.; Bakker, M. The influence of the length of the calibration period and observation frequency on predictive uncertainty in time series modeling of groundwater dynamics. WATER RESOURCES RESEARCH 2017, 53 (3), 2294-2311. DOI: 10.1002/2016WR019704.
Contact LiORA to discover how automated well influence analysis can identify cost savings at your sites in three days.

As CEO of LiORA, Dr. Steven Siciliano brings his experience as one of the world’s foremost soil scientists to the task of helping clients to efficiently achieve their remediation goals. Dr. Siciliano is passionate about developing and applying enhanced instrumentation for continuous site monitoring and systems that turn that data into actionable decisions for clients.